[Return to Device
Update]
Infinite
Energy Device Update
Published
in IE Volume 7, Issue #37, May-June, 2001
Sonofusion Calorimetry
Ken Rauen and Eugene Mallove
The replication of First Gate Energies’ sonofusion process has taken several
turns since the update in IE No. 36. The excess heat reported in that
issue was a last-minute inclusion before our print deadline. The experiment
was not complete. After the story went to press, the experiment was taken through
the final phase, that of post-calibration. The ultrasonic energy was removed
from the sonofusion reactor and the reactor was allowed to re-equilibriate at
a lower input power level.
Our computer data-logging and computational program recorded stabilization at
+6.3 watts excess heat. What this means is that the two calorimeters in combination—the
oscillator calorimeter and the reactor calorimeter (see last issue’s column)—lost
their calibration by drifting, and the data collected was unreliable. The post-calibration
ideally should have shown 0.0 watts excess heat. The problem was traced to the
airflow calorimeter for the reactor; its basic design was at fault, as heat
flow pathways are not perfectly consistent under all conditions. We opted to
replace that calorimeter with a Thermonetics Seebeck envelope calorimeter (see
IE No. 29 column, and photo in this issue, p. 59), which, theoretically,
integrates all heat flows. The sonofusion reactor had to be modified to fit
inside this calorimeter. The sight-glass and valving superstructure was removed,
and replaced by translucent teflon tubing and compression fitting disconnects.
The D2O level is observed through the tubing, and is kept above the reactor
so the reactor is full at all times.
The ultrasonic transducer oscillator calorimeter was modified also. The thermal
time constants of the two thermocouples used to determine differential temperature
were so different that a rapid change in room temperature produced errors in
the calculated heat dissipated. This was corrected by embedding the room temperature
thermocouple in a 50-gram piece of steel, which was wrapped in two inches of
fiberglass insulation. Now, normal room temperature fluctuations due to furnace
or air conditioning cycling result in about 0.1°C fluctuations in the differential
temperature.
This unusual calorimetric application for the oscillator is for the purpose
of determining the amount of electrical energy that drives the ultrasonic transducers
in the reactor. It is difficult to measure it directly, because of its complex
waveform (although we are preparing as an electronic cross-check to do that
too). In our indirect measurement, the heat dissipated by the oscillator calorimeter
is subtracted from the electrical power to the ultrasonic oscillator, delivered
from the wall socket and measured by a commercial power consumption meter. The
result is assumed to be the ultrasonic power according to conservation of energy.
This has been verified by one control test in which sonofusion was assumed to
be absent. The ultrasonic power calculated by this method agreed with the reactor
calorimeter when no joule heat was applied to the reactor, which kept the reactor
relatively cold and probably not producing any significant fusion heat. The
difference between the two methods was 0.35 watts.
Recent calibration runs of each calorimeter show errors of 0.65W maximum deviation
and 0.2W typical deviation from the exponential equation relating delta-T to
heat flow for the oscillator’s air flow calorimeter, and 1.2% deviation from
the straight line behavior of the Seebeck envelope calorimeter for the reactor,
which is 0.6W of measurement error at 50W of actual heat. A minimum of five
data points at varying power levels were measured for each calorimeter to establish
the calibrations. The errors are additive, so the system detection limit is
about 1.3W.
The copper target material inside the reactor has been changed to titanium.
It does not deteriorate like the copper; Roger Stringham of First Gate Energies
says it weathers far better than copper.
Four sonofusion runs have been completed. All four exhibited excess heat: 3,
3.5, 4, and 3 watts, in sequence, with 8 to 20 watts of ultrasonic power applied.
The reactor temperatures were around 130°C and argon pressure at 25, 30, 35,
and 0 psig, respectively. The first three were measured with a validating post-calibration
for zero excess heat. Those zero checks showed -0.1, 0.0, and +0.1 watts, respectively,
when the oscillator was turned off. The fourth run was unique. It accidentally
was run at 0 psig applied argon pressure (a second argon valve to the reactor
was accidentally left closed, and the reactor was operating at the vapor pressure
of the water at about 130°C) and the post-calibration was done by shutting off
the reactor joule heater, leaving the oscillator on. This fourth run exhibited
a “zero” of +3.1 watts excess! At present, we are not sure of what to make
of this result. It was followed by a joule heater recalibration of the oscillator
calorimeter at the same heat dissipation of about 10W, which showed a slight
deviation from the current calibration equation of only -0.4W, so this does
not explain the +3.1W. It is possible that sonofusion was occurring during this
intended null condition, producing excess heat that would make the two calorimeters
not balance. Roger Stringham asserts that low temperature and low pressure prevents
sonofusion. This one data point is of unknown value. Since it was collected
under the uncontrolled condition of no applied overpressure of argon, it could
be discounted because of procedural inconsistency, a bad test run. Each of these
sonofusion experiments lasted 24 hours total, including the high temperature
ultrasonic reaction and the post-reaction calibration, with the time for each
portion split approximately in half.
Despite the one confounding data point, NERL has substantial evidence that excess
heat from a cold fusion process has been documented at its facilities. However,
as in any experimental work, further difficulties might be encountered that
could alter this conclusion. We are planning, with the assistance of Chris Eddy
of Pioneer Microsystems, Inc., to develop a direct measurement of the input
electrical power. This should end any doubt about these results and we will
then proceed to a system re-design on the road to making scientific laboratory
demonstration kits.
Sonofusion Materials Analysis
Since heavy metal transmutation phenomena have been so widely seen in this
field, we considered it important to have an outside laboratory perform surface
analysis of the second copper target that had undergone prolonged ultrasonic
activation. We employed Geller MicroAnalytical Laboratory of Topsfield, Massachusetts.
Using a JEOL SEM with Auger Electron Spectroscopy (AES) Microprobe, one of the
pitted regions of the copper target was examined. About twenty of these regions
surrounded the central perforation of the Cu target at a radial distance of
about 1 cm.
Figure 1 at 45X shows the strange eroded canyon-like features (note the imprinted
scale) on the copper. Figure 2 is at 750x and the imposed rectangular area
bracketing the magnified “promontory” indicates the region that was examined
for unusual elements by the Auger electron beam. Figure 3, also at 750X, is
of a nearby “smooth,” unaffected Cu surface, very much different than the activated
region.
Using the element analysis feature, the Auger electron spectrum was obtained
for both the smooth and affected Cu surfaces. Only copper emission lines were
seen with a very low aluminum peak present in both the smooth surface region
(Figure 4) and in two areas of the activated surface (see Figures 5 and 6).
There was no evidence of any unusual elements present. Bear in mind that convincing
excess heat was not measured in the ultrasonic exposures of the copper foil.
|
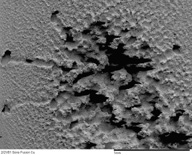
Figure 1. Copper target surface pitted by ultrasonic activation
in D2O (at 45x).
|
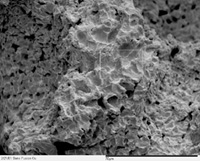
Figure 2. Magnified view (750x) of small "promontory
on copper target pitted region.
|
|
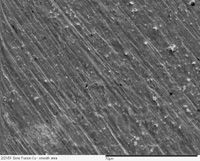
Figure 3. "Smooth", non-pitted region of copper
target.
|
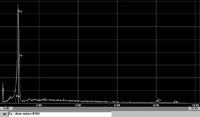
Figure 4. Auger electron (AES) analysis of "clean" copper surface
("smooth") region, showingonly Cu peaks.
|
|
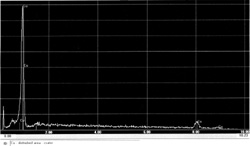
Figure 5. Auger electron (AES) analysis of pitted area
of copper target. No unusual element peaks are seen.
|
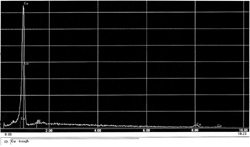
Figure 6. Auger electron (AES) analysis of pitted area
of copper target, remote form central area of pitting.
|
[Top of Page]